
-
Select the WAN Usage tab to view the usage of all WAN interfaces.
-
Select the Organization, Sites and Period as described on the Reports page (default period: 7 Days).
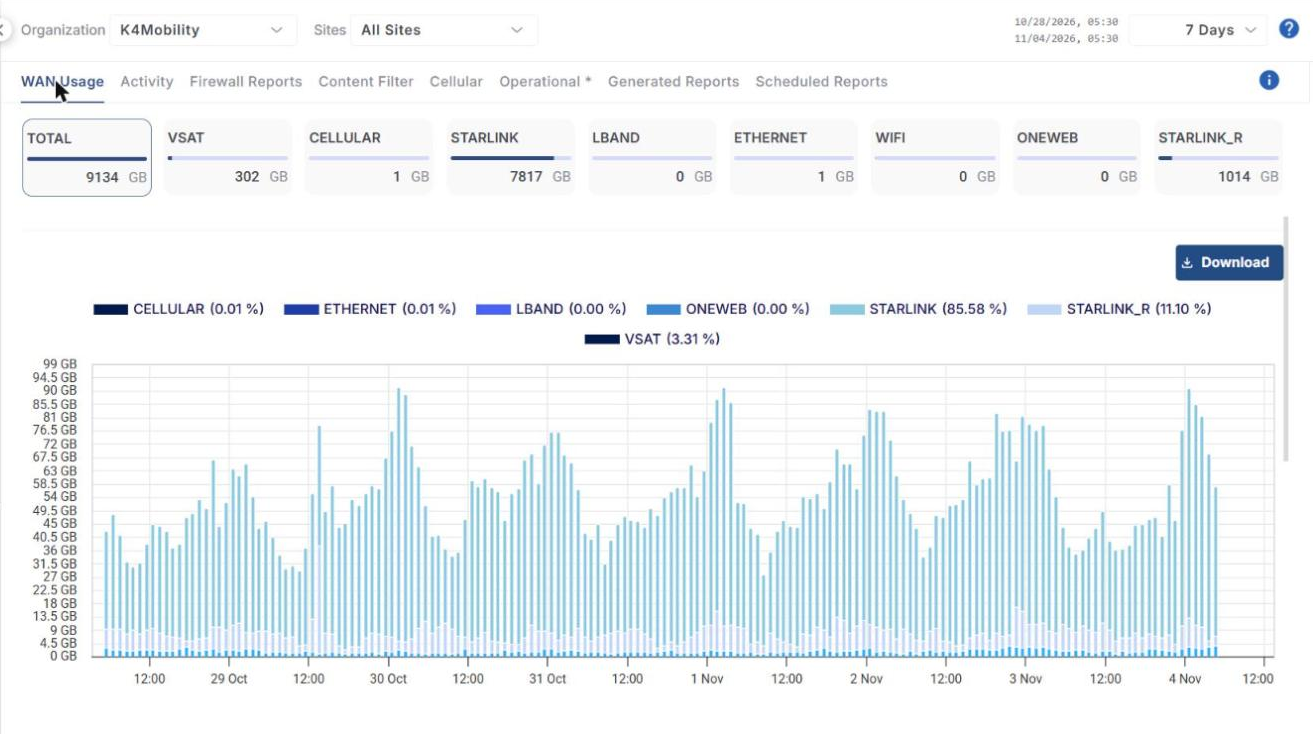
Usage cards
The cards at the top show the data consumed (in GB) in the selected period:
-
Total – total data consumed across all WAN interfaces of the selected organization and sites.
-
VSAT, Cellular, Starlink, LBand, Ethernet, Wifi, OneWeb and Starlink_R – data consumed on each WAN type.
-
Click a card to filter the whole tab (chart and List of Sites) to that WAN type. Click Total to show all WAN types again.
Usage chart
-
The bar chart shows the data used over time. The horizontal axis shows the time and the vertical axis shows the amount of data used.
-
The legend at the top of the chart identifies each WAN type and shows its share of the total usage as a percentage, for example STARLINK (85.58 %).
-
Click Download to download the usage data.
List of Sites
-
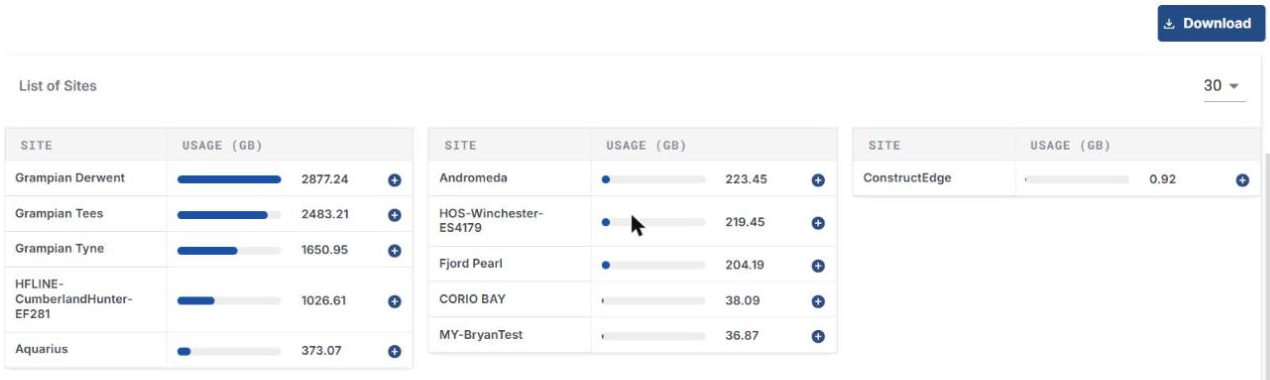
The List of Sites table lists the sites of the selected organization with their data usage (GB), sorted from highest to lowest. The sites are shown in three columns.
-
Use the dropdown at the top-right of the table to change the number of sites shown (default 30).
-
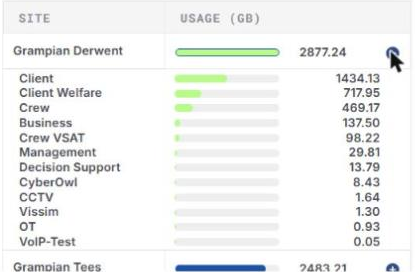
Click the + icon next to a site to view its usage broken down by access network (for example Client, Crew, Business).
Information
Click the info (i) icon at the right of the tab bar for a note on how WAN usage is measured. WAN usage is measured on the Edge for each WAN interface, so it may differ from the usage reported by the carrier (for example Starlink or T-Mobile) because of radio network and operational overheads. On average, Starlink-reported usage is about 8% higher than the Edge Starlink WAN usage.