The Reports screen shows the amount of data consumed by the sites and users of an organization. It also gives further breakdowns by WAN usage, user and application activity, firewall rules, content filter, cellular details, and generated and scheduled reports.
-
Select Reports from the left menu of CommBox Edge Cloud Portal.
-
In the Organization field, select the organization or sub-organization. The organization of the logged-in user is selected by default, and the list contains all of its sub-organizations.
-
In the Sites field, select the required sites (default: All Sites).
-
Select the Period from the dropdown at the top-right. The default period is 7 Days. The start and end of the selected period are shown next to the dropdown. You can also select a custom time interval.
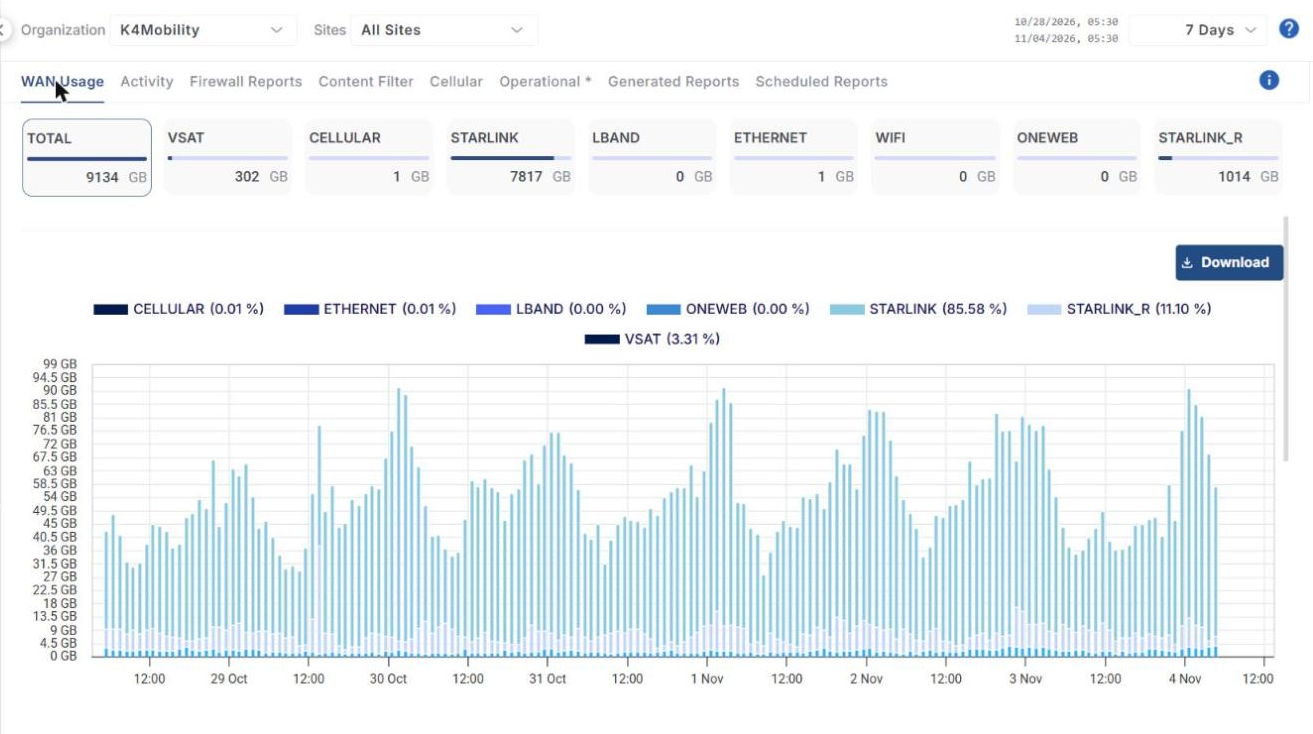
The Reports screen has the following tabs: WAN Usage, Activity, Firewall Reports, Content Filter, Cellular, Operational *, Generated Reports and Scheduled Reports.
Tabs marked with an asterisk (*) are restricted features and are not covered in this guide.
The following pages explain the data displayed in the different tabs of the Reports screen: