The Alerts screen shows the alerts raised for the sites of the selected organization. Select Alerts from the left menu of CommBox Edge Cloud Portal to open it. The screen has three tabs: Alerts, Events and Alerts - Config.
-
In the Organization field, select the organization or sub-organization. The organization of the logged-in user is selected by default, and the list contains all of its sub-organizations.
-
In the Sites field, select the required sites (default: All Sites).
Current and History views
-
Use the History / Current toggle to switch between the two views:
-
Current (default) – shows only the alerts that are currently in Alerting status.
-
History – shows both Alerting and Normal alerts raised in the selected period.
-
-
The following options are available only in the History view:
-
Period selector at the top-right (default 7 Days).
-
Alerting and Normal checkboxes – filter the table by alert status.
-
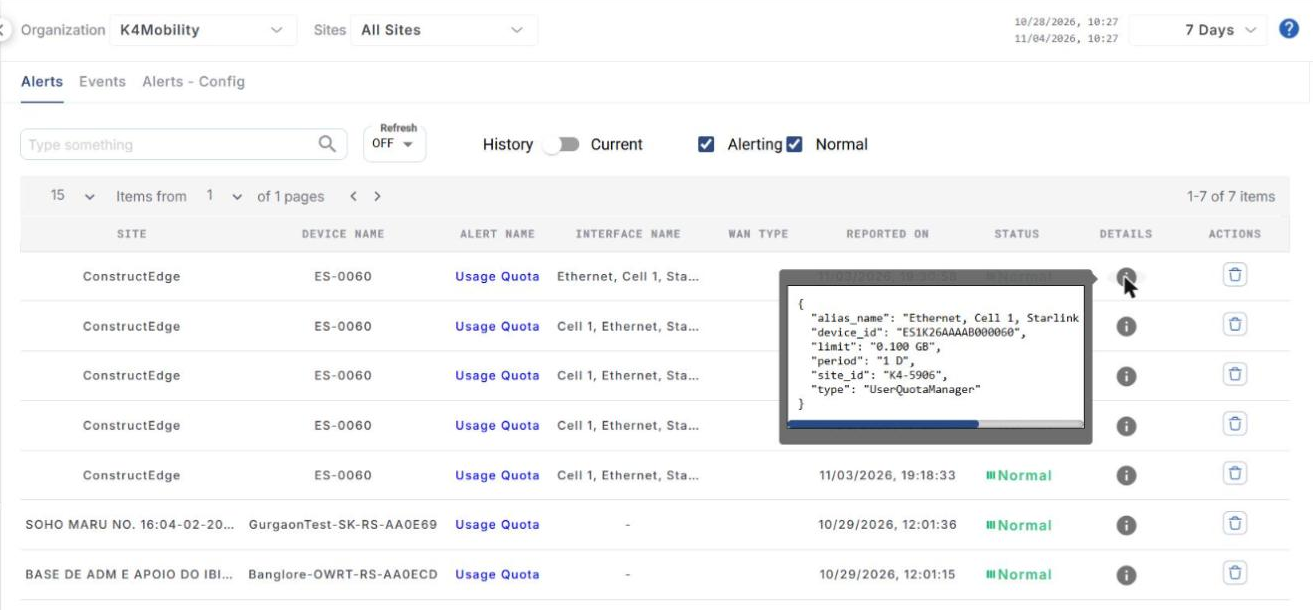
Alerts table
The table shows the following information:
-
Site – name of the site.
-
Device Name – name of the device.
-
Alert Name – name of the alert (for example Usage Quota).
-
Interface Name – interface(s) the alert applies to.
-
WAN Type
-
Reported On – date and time of the alert.
-
Status – Alerting or Normal.
-
Details – click the info icon to view the alert metadata, for example alias name, device ID, limit, period, site ID and type.
-
Actions – click the delete icon to delete the alert from the list.
Other options
-
Use the search field to find alerts by Site, Device Name, Alert Name, Interface Name or WAN Type.
-
In the Refresh field, select how often the table is refreshed automatically: OFF (default), 1m, 5m or 15m.
-
Use the page-size selector and the arrows above the table to move between pages.