Usage Status
The Usage Status area provides a tabular view of the Networks and Users that pass traffic through the CommBox EdgeOS device. Once the CommBox EdgeOS System is configured, user can monitor the usage of the networks and devices connected to the networks.
The Top Networks table shows the WAN type usage grouped by network.
The Top Devices table lists the users with their associated network and shows the individual WAN Type usage over the specified period.
To view the Network usage details, perform the following steps.
Steps
· Log on to the CommBox EdgeOS System. The home page appears.
· Click the menu icon. The menu appears.
· Click Usage Status. The Usage Status page appears, see figure below.
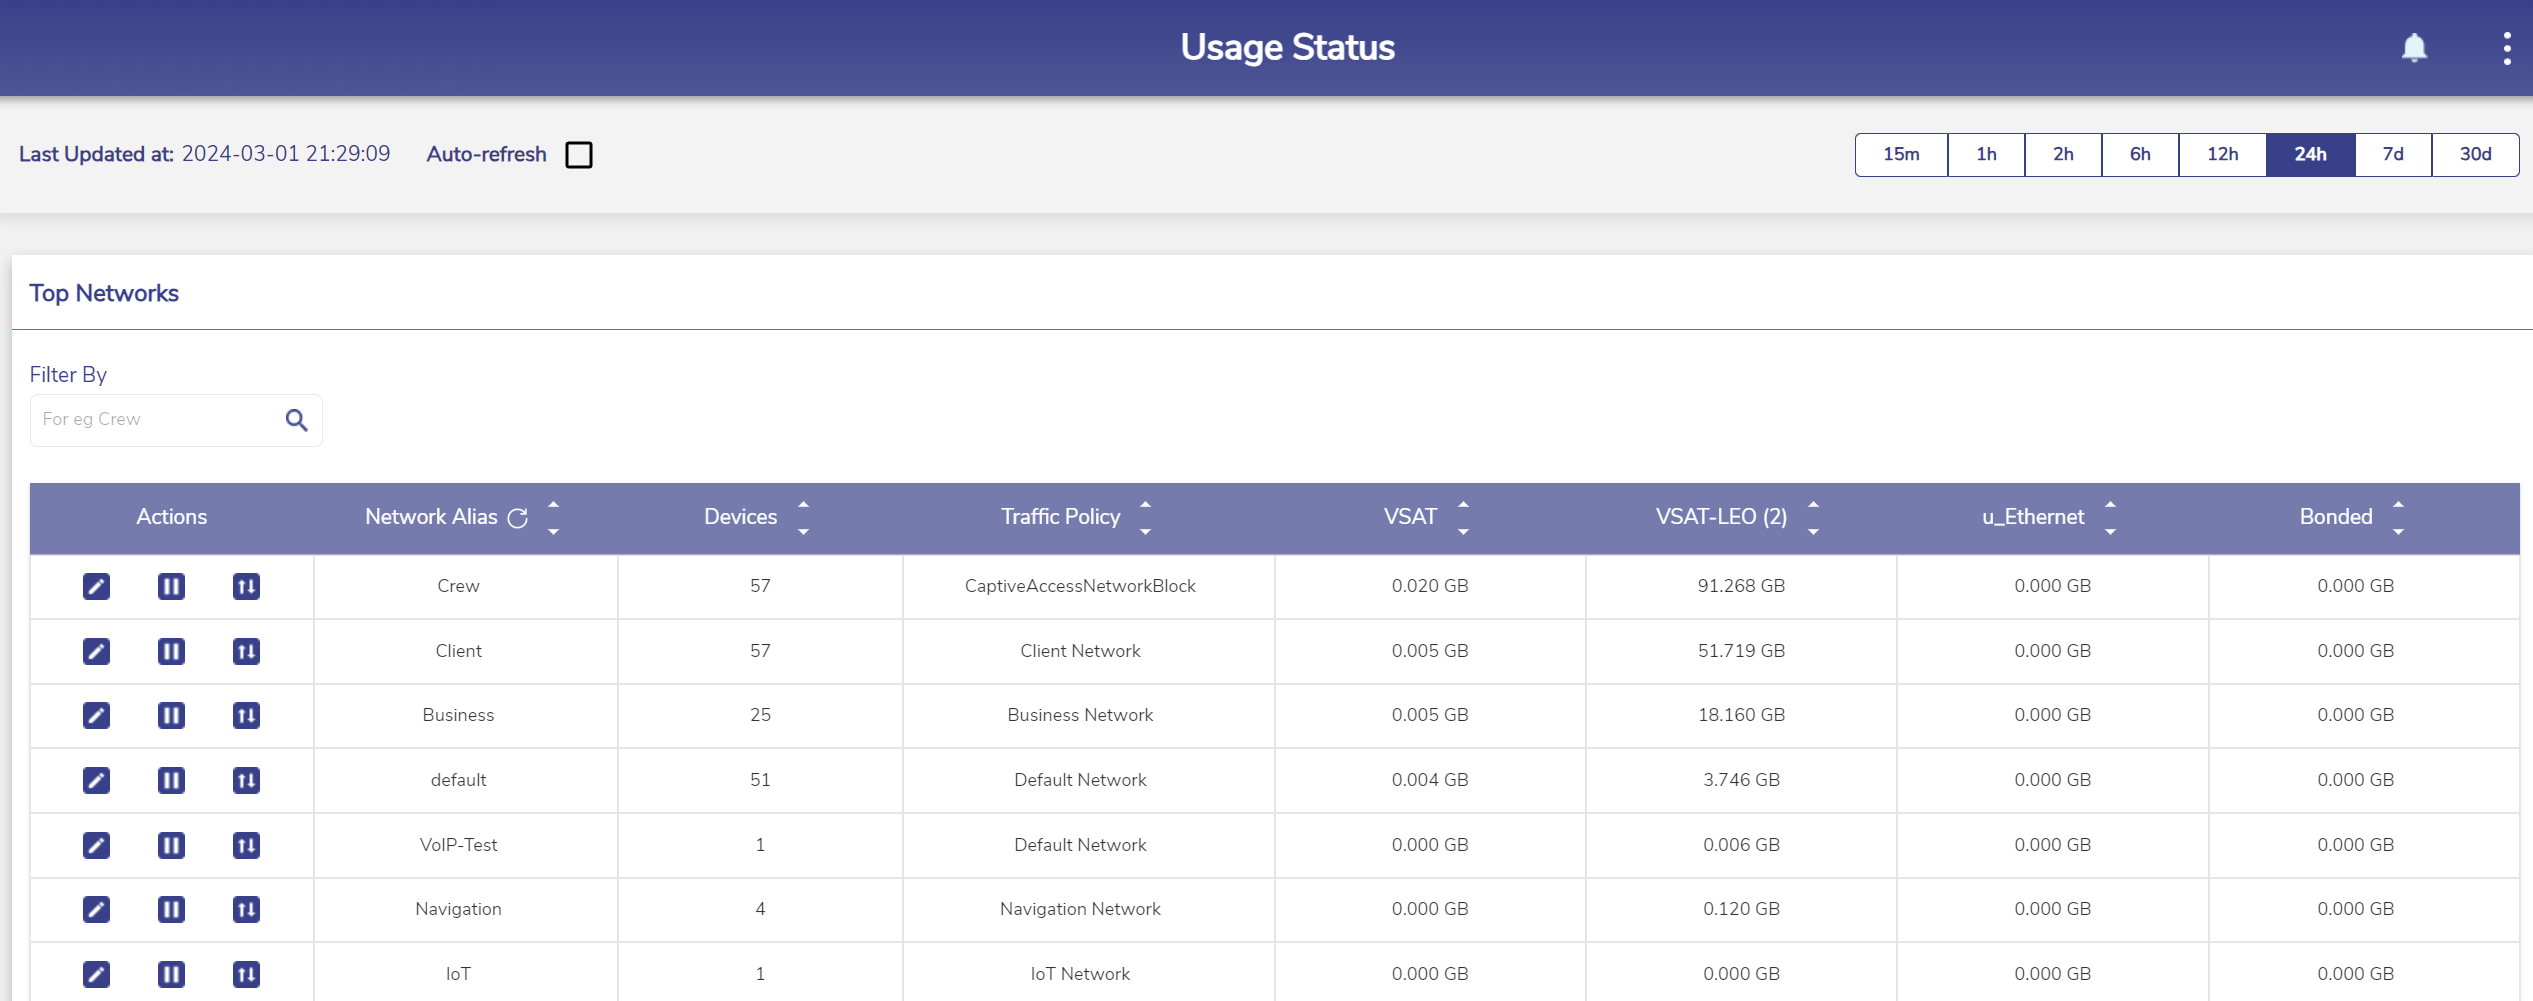

Usage Status
Initially, the Default network is only available. Once, the networks and devices are configured, the networks and devices become available on the Usage Status page. See figure below.
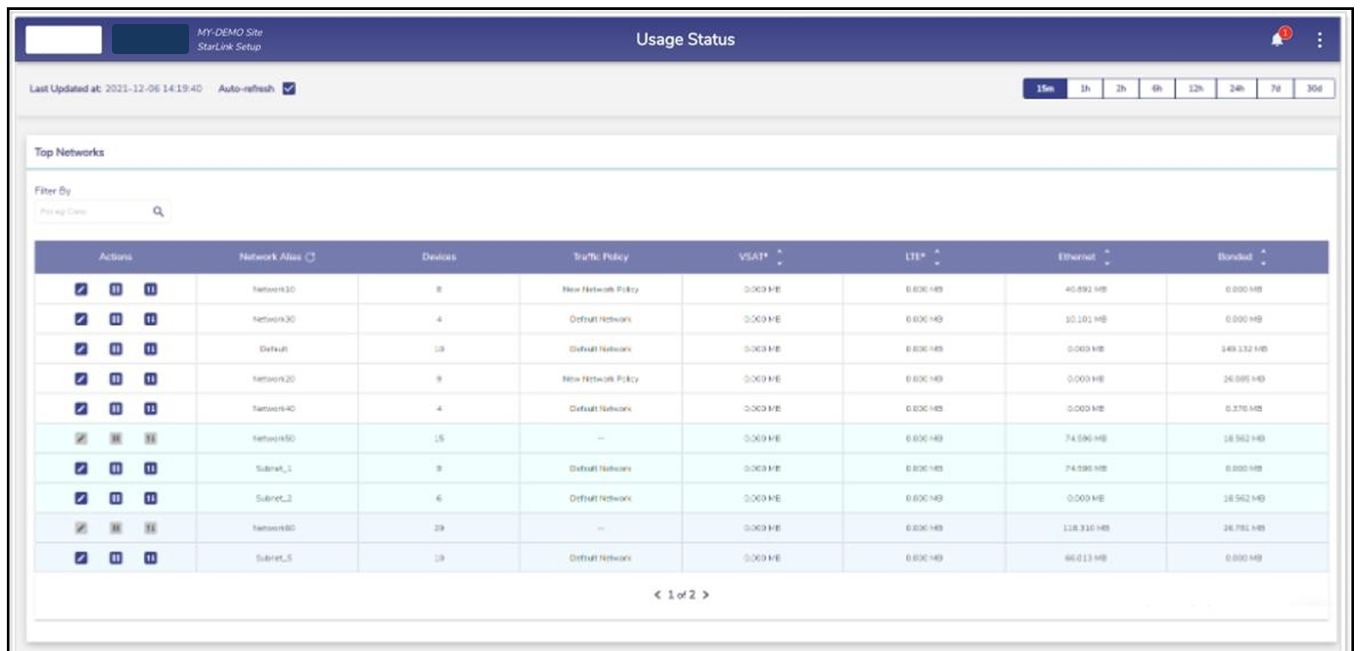
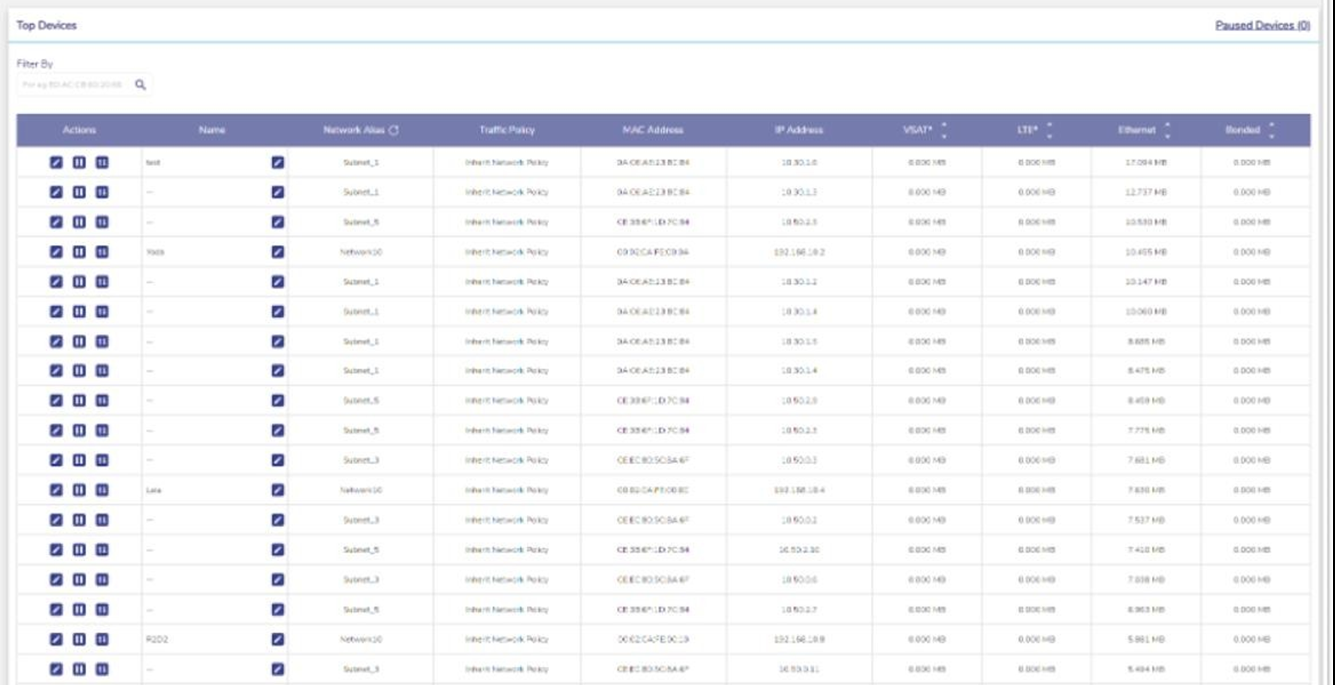
Configured Usage Status
The Usage Status page includes the Top Network and Top Devices sections.
Top Networks
· This table lists the networks in descending order of the usage. The following details are available under the Top Networks section.
· Traffic policy assigned to the network.
· Data usage on each Interface by the network.
· Count of the devices connected to the network.
· The routed access network and corresponding grouping.
· View details of the specific network, user can search for that network.
To search the network, enter the name of the network in the Filter By field. Details of the network become available. The name of the network is displayed under the Network Alias field.
To view the usage of the network based on periodicity, click the duration in the upper right of the page.
Modifying Traffic Policy of a Network
To modify the traffic policy of the network, perform the following steps.
Steps
· Click Pencil icon corresponding to the Network in the Action field under the Top Networks section. The Edit Traffic Policy profile page appears, see figure below.
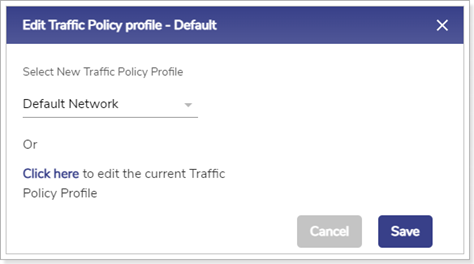
Edit Traffic Policy Profile
· In the Select New Traffic Policy Profile list, click new traffic policy.
Or,
To modify the current traffic policy, select Click here. The Traffic Policies page appears. For details, see section Traffic Policies.
· Click Save.
Pausing Traffic on a Network
To pause the internet of the network, perform the following steps
Steps
· Click Pause icon corresponding to the routed network in the Action field under the Top Networks section. The Pause Internet page appears, see figure below.
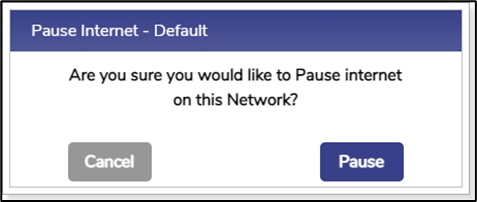
Pause Internet
· Click Pause. The resume button becomes available.
Additionally, the Pause icon becomes available corresponding to the network, see figure below.

Paused Network
The internet is paused. However, this does not impact the other networks.
Resuming Traffic on a Network
To resume the internet of the network, perform the following steps.
Steps
· Click Resume button corresponding to the network in the Action field under the Top Networks section. The Resume Internet page appears, see figure below.
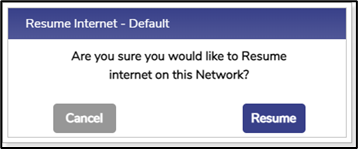
Resume Network
· Click Resume.
The Internet on the network is resumed.
Viewing Top Applications for a Network
To view top application details on a network, perform the following steps.
Steps
· Click Traffic Details icon corresponding to the network in the Action field under the Top Networks section. The Traffic Details page appears, see figure below.
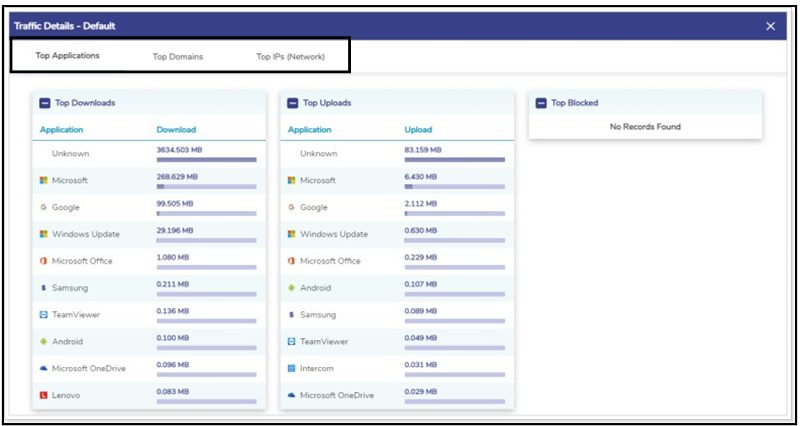
Traffic Details
· To view details of the top applications, click Top Applications. By default, details of the top applications are available. This shows the Top Downloads, Uploads and Blocked applications.
· To view details of the top domains, click Top Domains.
· To view details of the top IPs, click Top IPs (Network).
Top Devices
The following details are available under the Top Devices section.
· All the devices connected to the entire network. Following is an example.
· If the sum of the devices in the Devices field under the Top Network section is 20, then the details of all the 20 devices become available.
· MAC address of the device.
· IP Address of the device.
· Data consumed by device on interfaces in the network.
To search the device, enter the name of the network in the Filter By field. Details of the network become available.
On the top right of the table, there is Paused Devices hyperlink along with number of paused devices in the system mentioned in brackets.
Viewing list of Paused Devices
To view list of Paused Devices, perform the following steps.
Steps
· Click Paused Devices on the top right of the Top Devices table, see Figure Paused Devices Link. The Paused Devices Pop-up appears, see Figure Resume Internet. This shows the list of paused devices in the system.
· Click the resume button next to the paused device to resume internet on that device.

Paused Devices Link
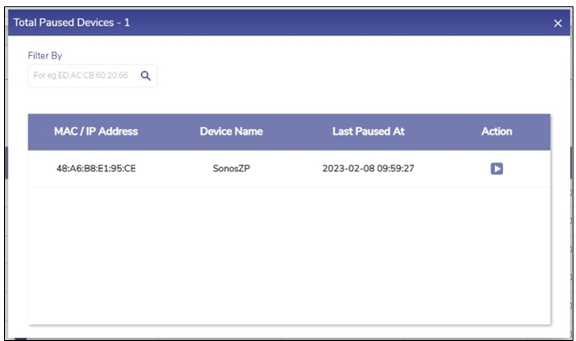
Paused Devices
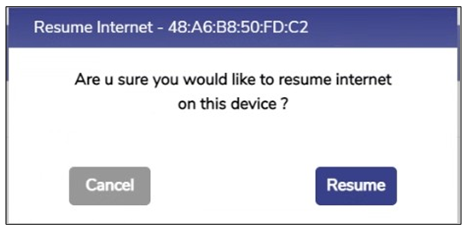
Resume Internet
Editing Traffic Policy of a device
To modify the traffic policy of the Device, perform the following steps.
Steps
· Click Pencil icon corresponding to the Device in the Action field under the Top Devices section. The Edit Traffic Policy profile page appears, see figure below.
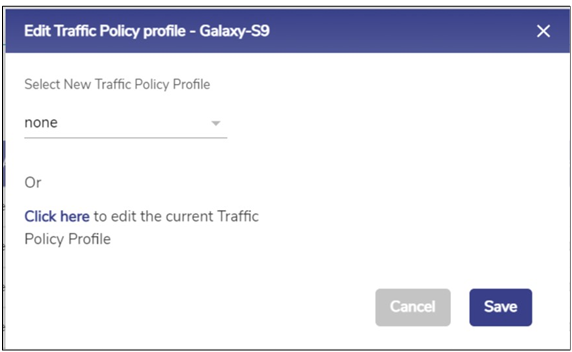
Edit Traffic Policy Profile
· In the Select New Traffic Policy Profile list, click new traffic policy.
Or,
To modify the current traffic policy, Click here. The Traffic Policies page appears. For details, see Traffic Policies.
· Click Save.
Pausing internet on a device
To pause the internet of the device, perform the following steps.
Steps
· Click Pause icon corresponding to the device in the Action field under the Top Devices section. The Pause Internet page appears.
· Click Pause. The resume button becomes available.
The internet is paused. However, this does not impact the other devices in the network.
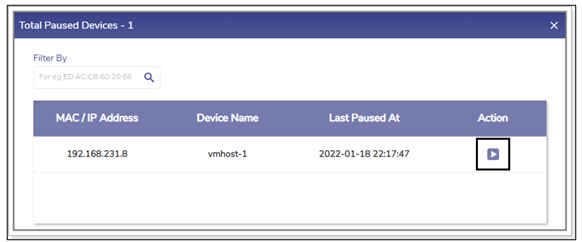
Total Paused Devices
Resuming internet on a Device
To resume the internet of the device, perform the following steps.
Steps
· Click Resume button corresponding to the device in the Action field under the Top Devices section. The Pause Internet page appears.
· Click Resume.
The internet is resumed on the device.
Viewing Top Applications for a Device
To view top application details for a device, perform the following steps.
Steps
· Click Traffic details icon corresponding to the device in the Action field under the Top Devices section. The Traffic Details page appears, see figure below.
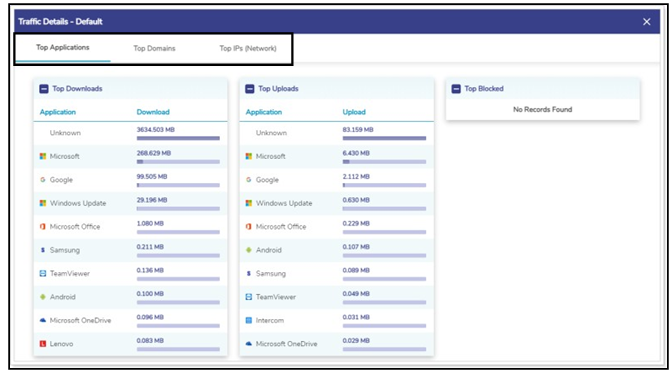
Traffic Details
· To view details of the top applications, click Top Applications. By default, details of the top applications are available. This shows the Top Downloads, Uploads and Blocked applications.
· To view details of the top domains, click Top Domains.
· To view details of the top IPs, click Top IPs (Network).
